Our Sustainability Initiatives
The NTT DOCOMO BUSINESS Group aims to realize a sustainable future. As your value partner, we will take initiatives to overcome social challenges and drive the emergence of new value by creating a new way of communication that will open the door to possibilities for people and the world.
Message from CEO / NTT DOCOMO BUSINESS Group Sustainability / Sustainability Magazine / Sustainability Report
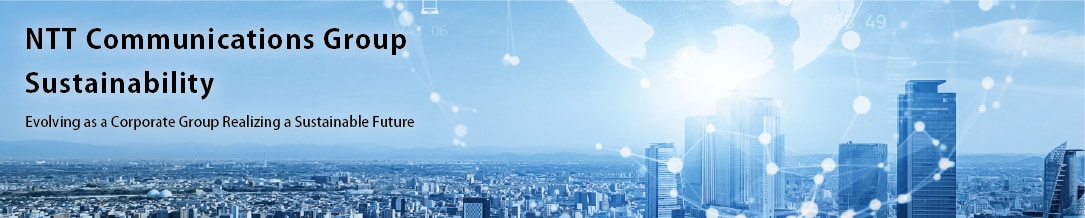
NTT DOCOMO BUSINESS Group Sustainability
-
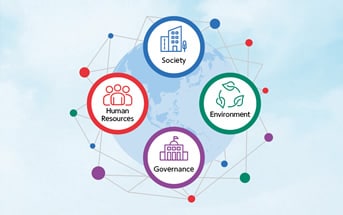
Sustainability Policy and Four Priority Areas
-
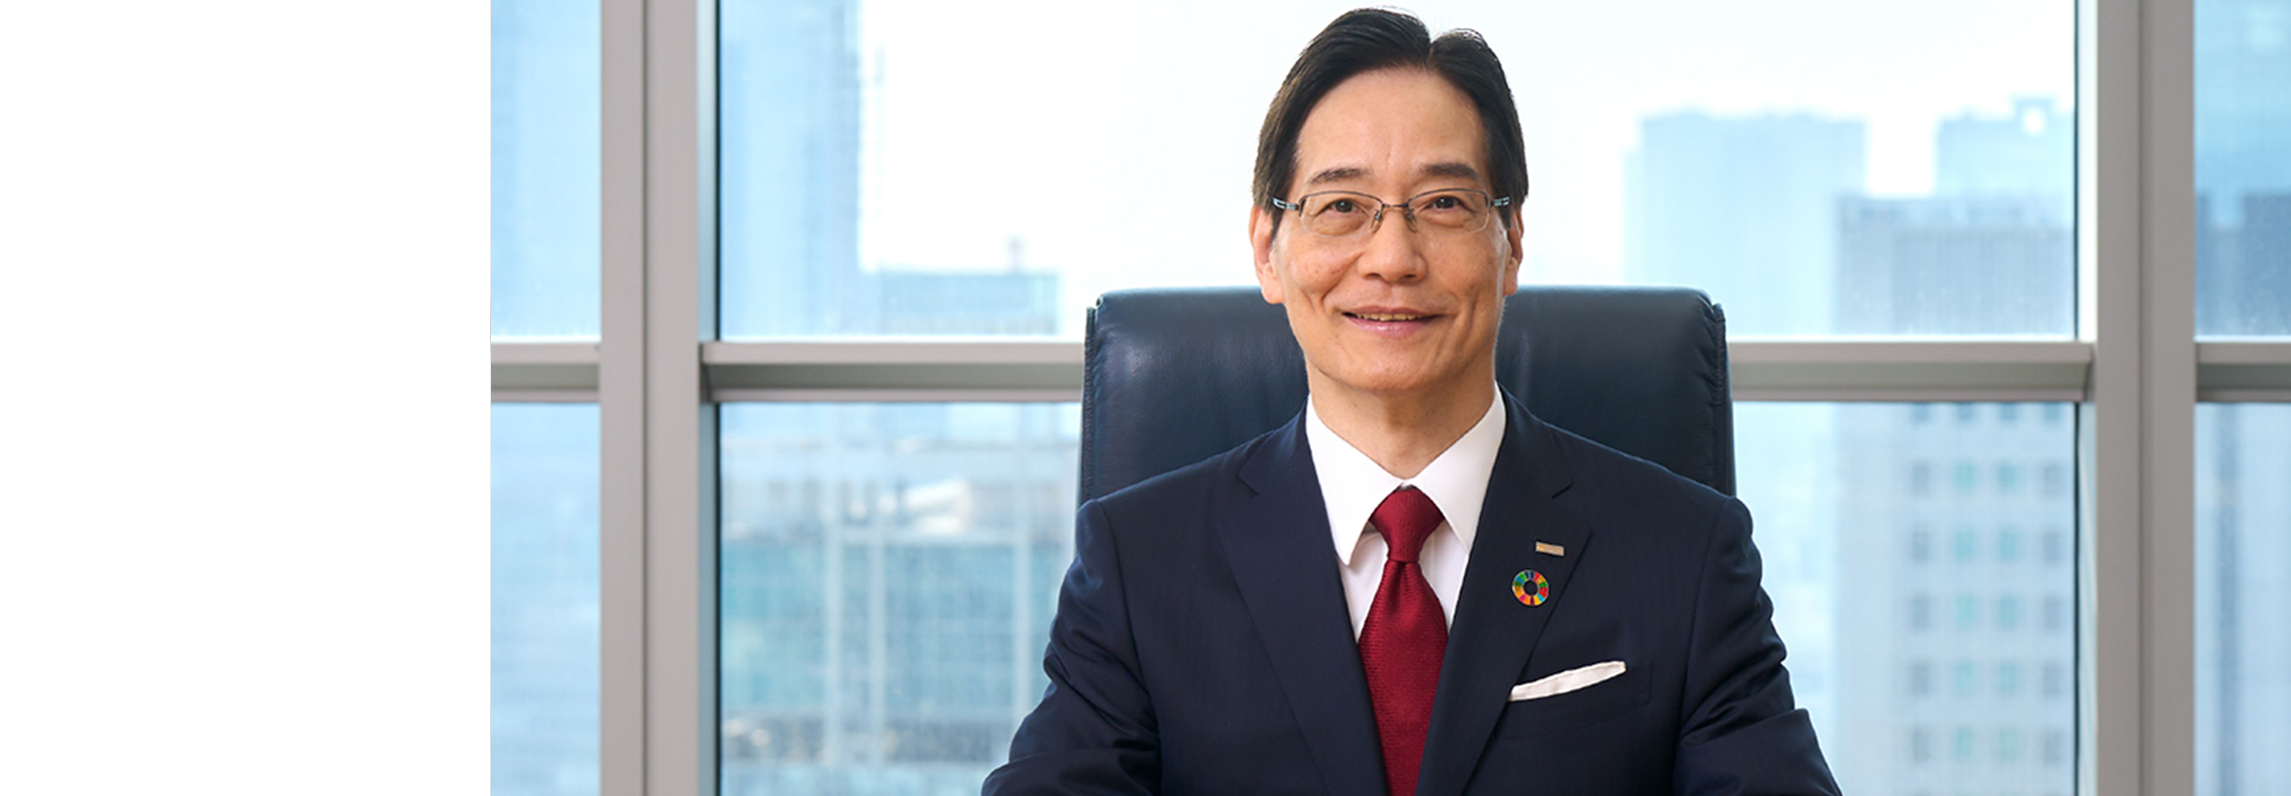
Executive vice president’s message about the Company’s sustainability initiatives
-

Sustainability Management
-
Materiality and KPIs
-

Creating a Sustainable Future
Initiatives for Each Priority Area


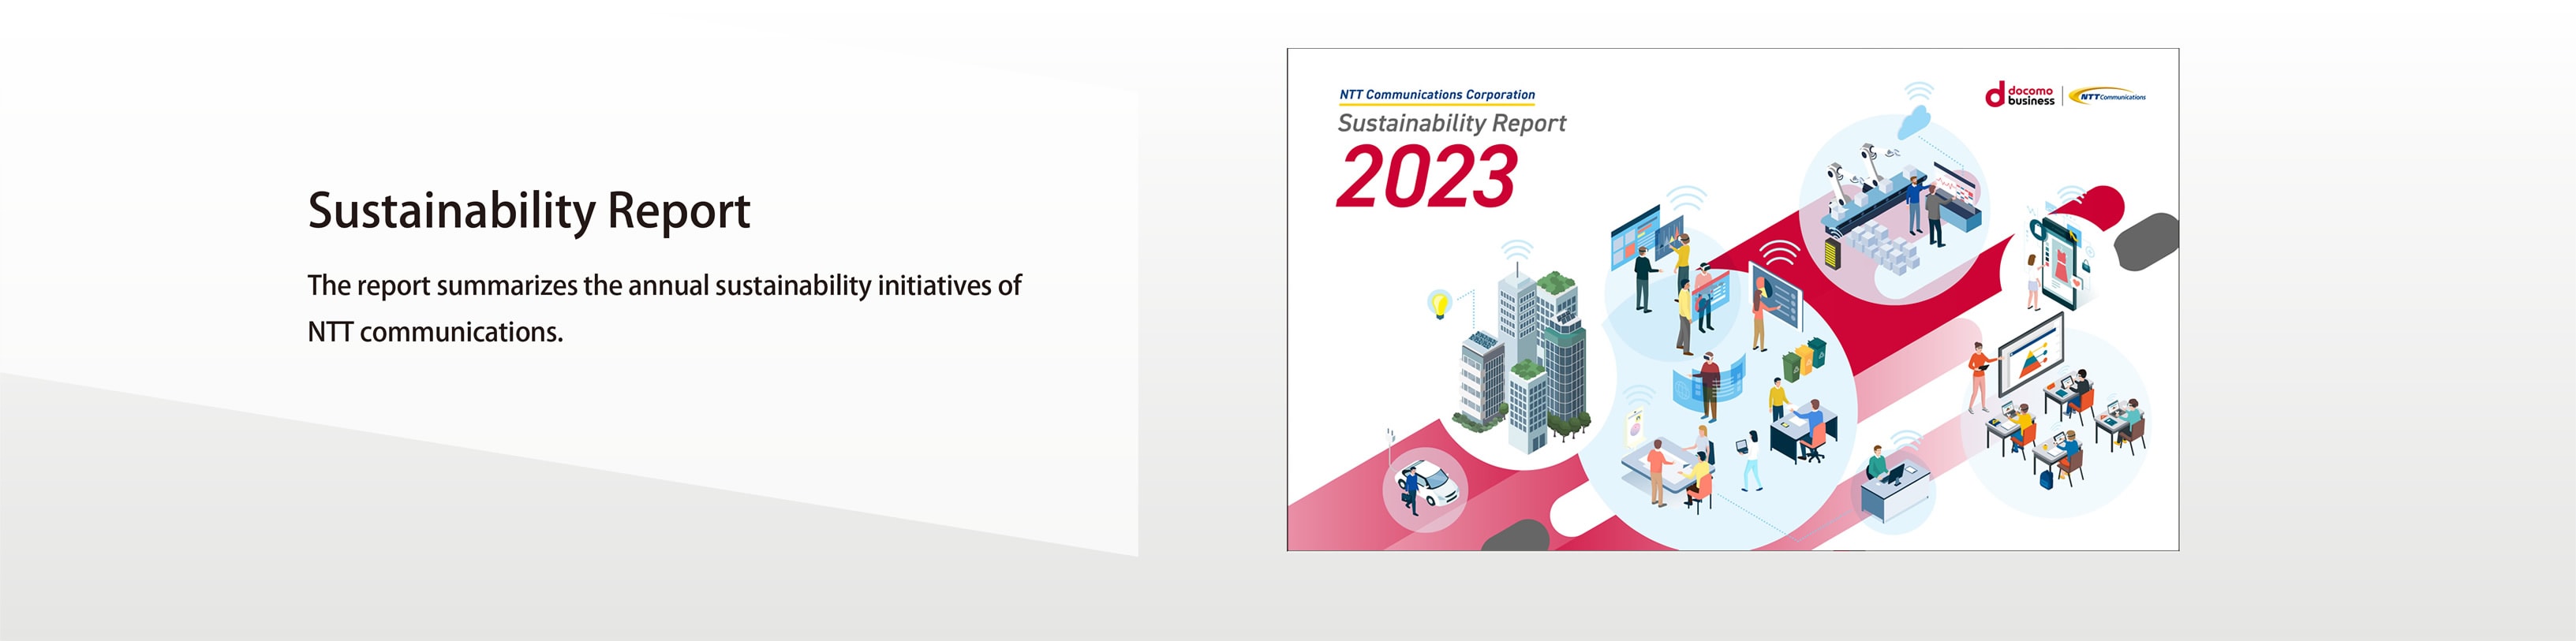
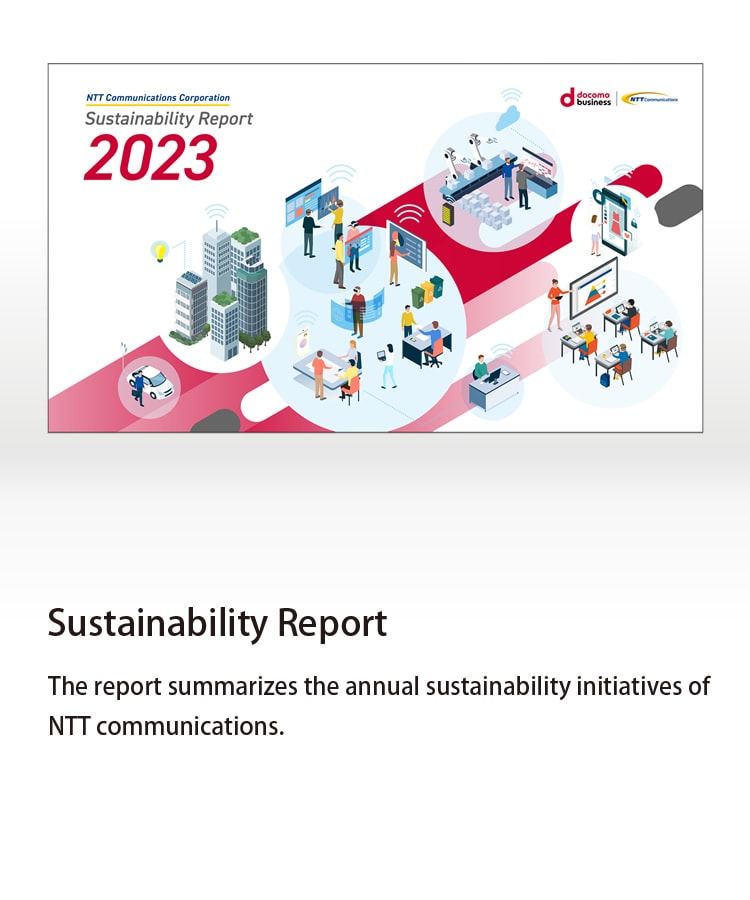
Sustainability Magazine
We provide sustainability-related information from various angles.
External Evaluations and Certifications
NTT DOCOMO BUSINESS has received a number of external evaluations and certifications for sustainability activities conducted through its business.
- Globally Recognized Achievements
-
-
Certified “Bronze” in the 2025 sustainability assessment by France-based EcoVadis
-
Received seven awards, including the Overall Grand Prize for Nexcenter and the Runner-up Grand Prize for BConnection Digital Trade in the 17th ASPIC Cloud Awards 2023, held in November 2023
-
- Initiatives for Improving Workplace Environments
-
-
Kurumin Certification
(October 2017) -
Platinum Kurumin Certification
(October 2017) -
Eruboshi Certification
-
Top Hundred Telework Pioneers
-
Tomonin logo
-
- Initiatives for Raising Employee Health
-
-

Certified Health and Productivity Management Organization 2025, large enterprises category
-
- Initiatives for LGBT Issues
-
-
PRIDE INDEX 2024 Gold Rating (the Non-profit Organization “work with Pride”)
-
Information Search by Stakeholder
Articles can be searched by stakeholders closely connected to NTT DOCOMO BUSINESS.
-
Business
Partners -


Customers
-
External Rating
Organizations -

Employees
-
Society
at Large -
Shareholders
and Investors
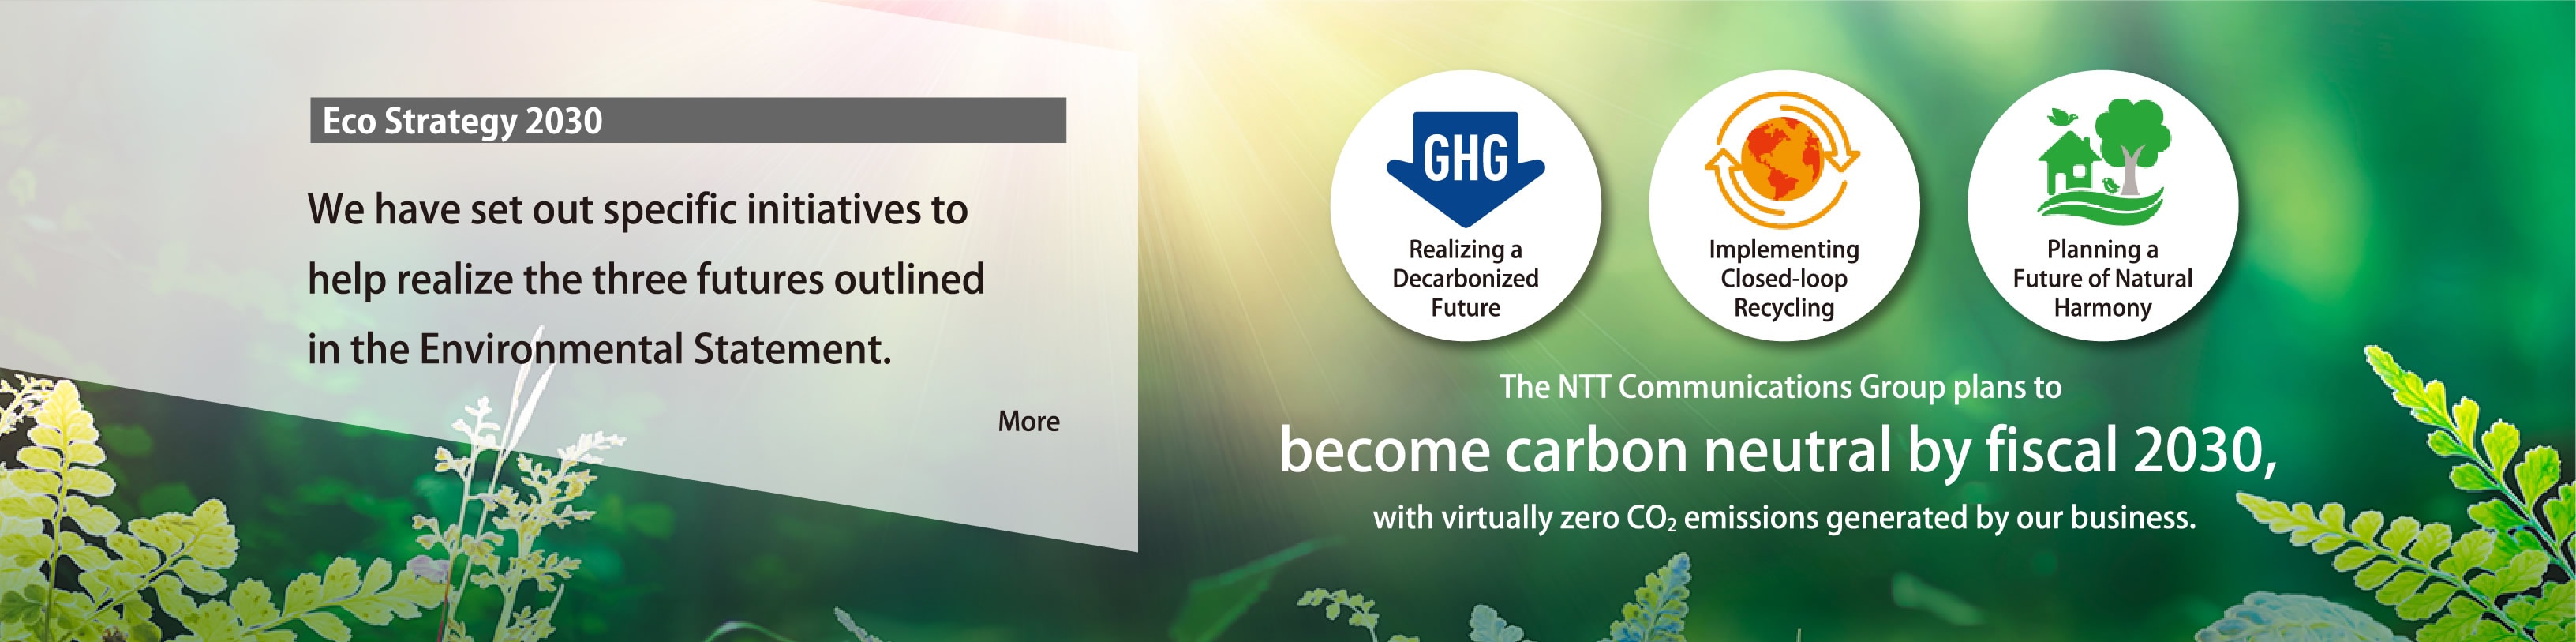
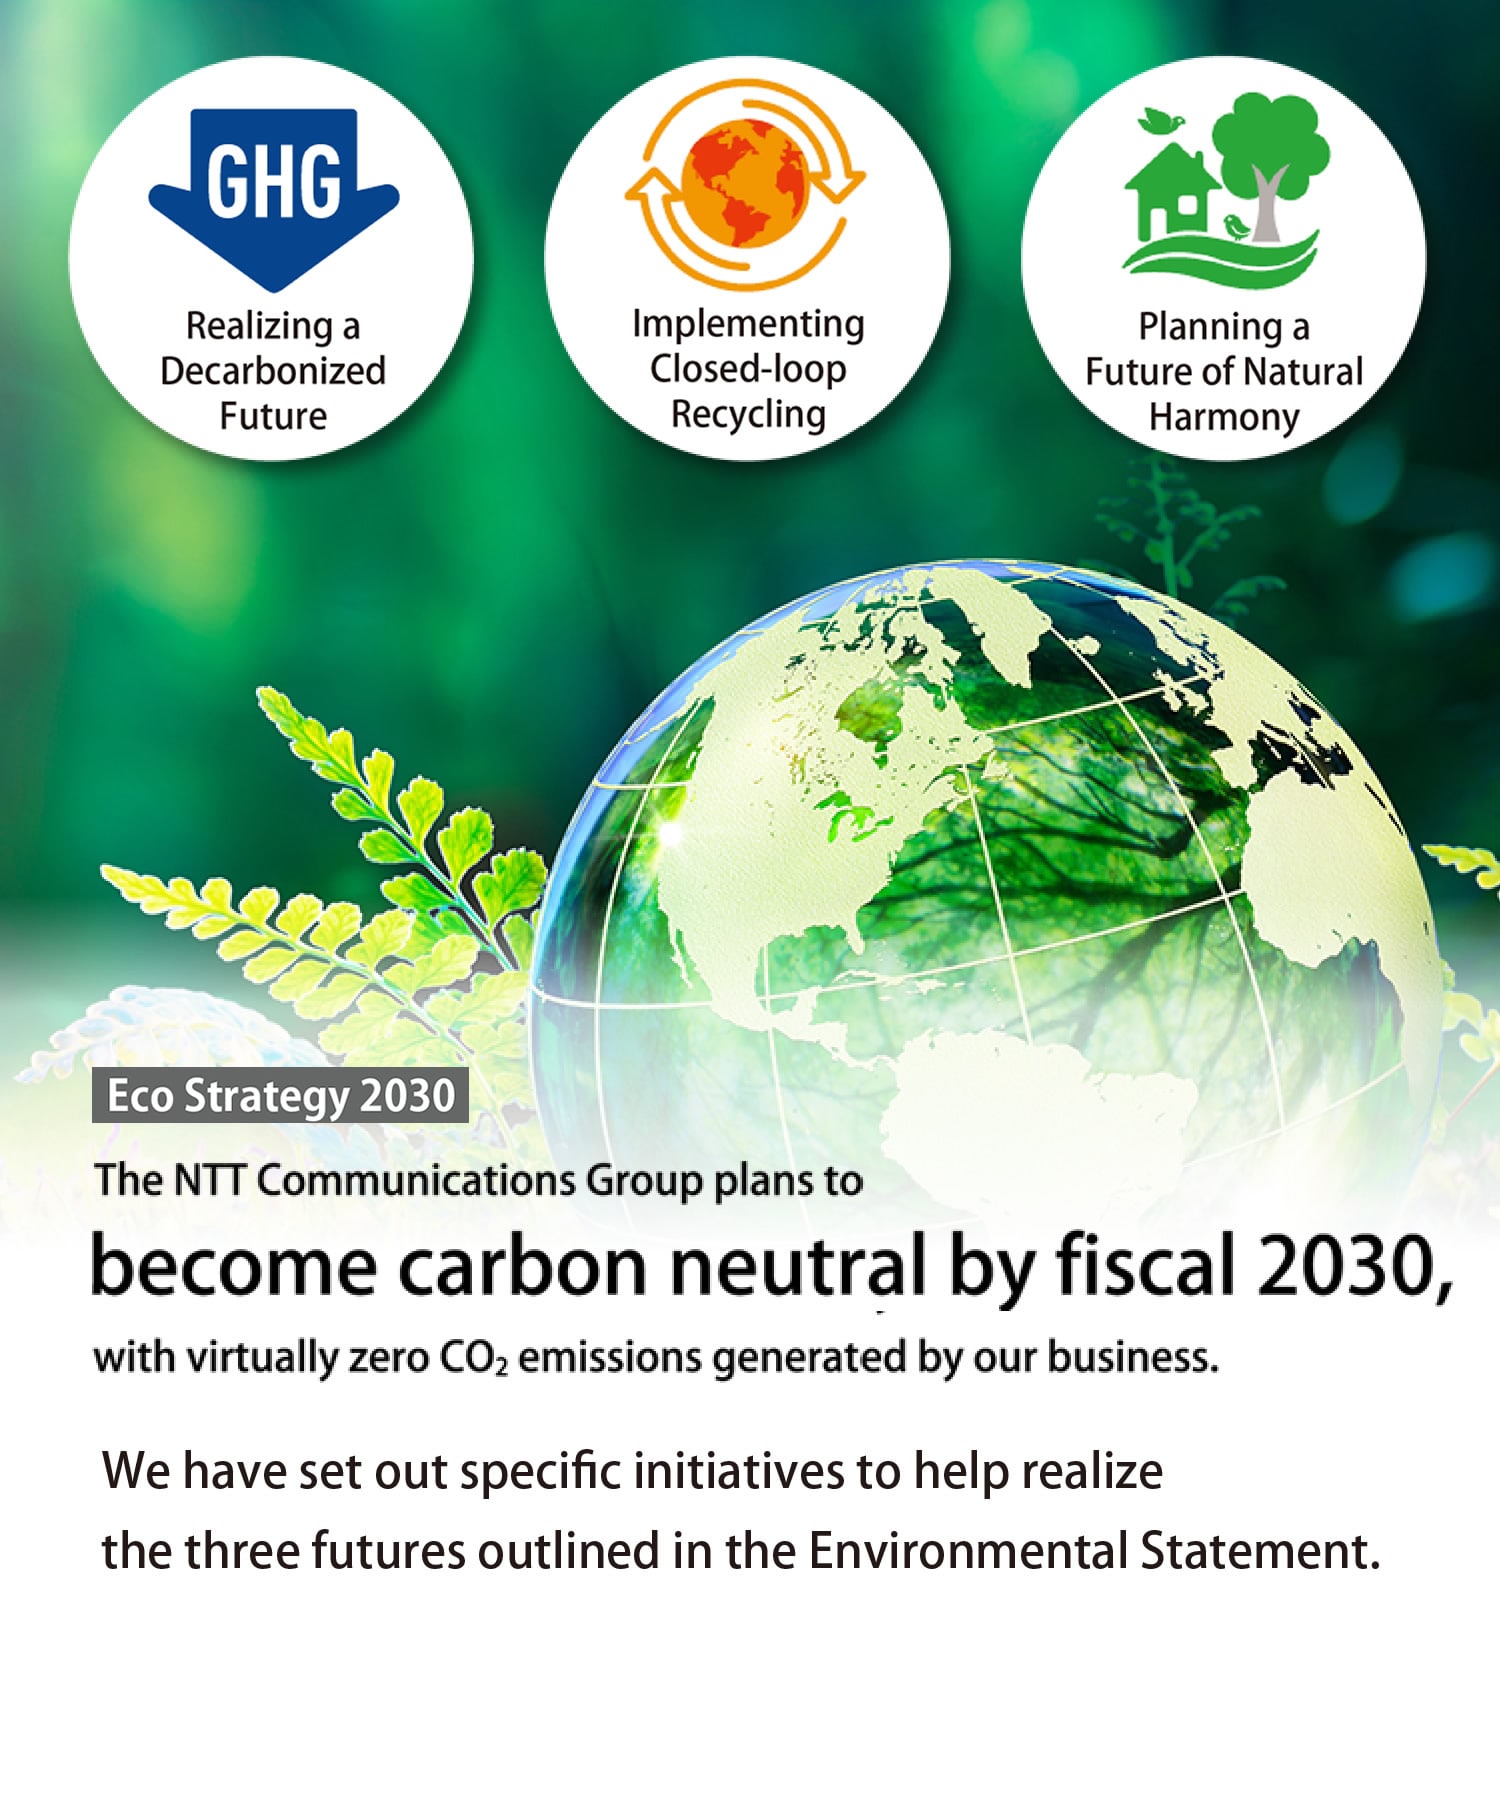
Respect for human rights / Sustainability Management / Environment /
Continuously strengthening information security / Statement under UK Modern Slavery Act 2015 / Thorough compliance and risk management
Transformation of ICT infrastructure /
Overcoming Social Challenges through Our Business / Promotion of DX to connect society with the future /
Promotion of innovations that breakthrough boundaries / Sustainability Magazine / NTT STORY
Society / Environment / Human Resources / Governance /
Sustainability Management / Overcoming Social Challenges through Our Business /
External Evaluations and Certifications
Respect for human rights / Sustainability Management /
Group-wide Corporate Ethics Help Line / Overcoming Social Challenges through Our Business / Sustainability Magazine /
Society / Environment / Human Resources / NTT STORY / Thorough compliance and risk management
Related information
Related Links
 In order to read PDF documents, you need Adobe Reader.